Her på Blåvand's blog bringes korte nyheder i dagbogsformat om livet og hændelser på fuglestationen.
No obs today but the opportunity to talk about my project on waders data analysis!
Second to last day for me at the station, after two months of observation and working on an original project to which I dedicated a lot of time. Due to the rain, I couldn't go out for observations today, so I took the opportunity to finish the project and present it to Henrik this afternoon.
So this is a chance for me to tell you a bit more about it; I think I mentioned it on the blog a few weeks ago.
As an observer, we primarily collect scientific data, which has been used in various studies since 1963. Often, this involves tracking the total number of individuals of different species through time series graphs. However, we also have information on age. My main objective was to find a way to add this age information to the graphs. Additionally, it was necessary to smooth the curves by calculating moving averages. Finally, to ensure the data is comparable from year to year, it was important to adhere to standard observation conditions (3 hours after sunrise) and to disregard other data.
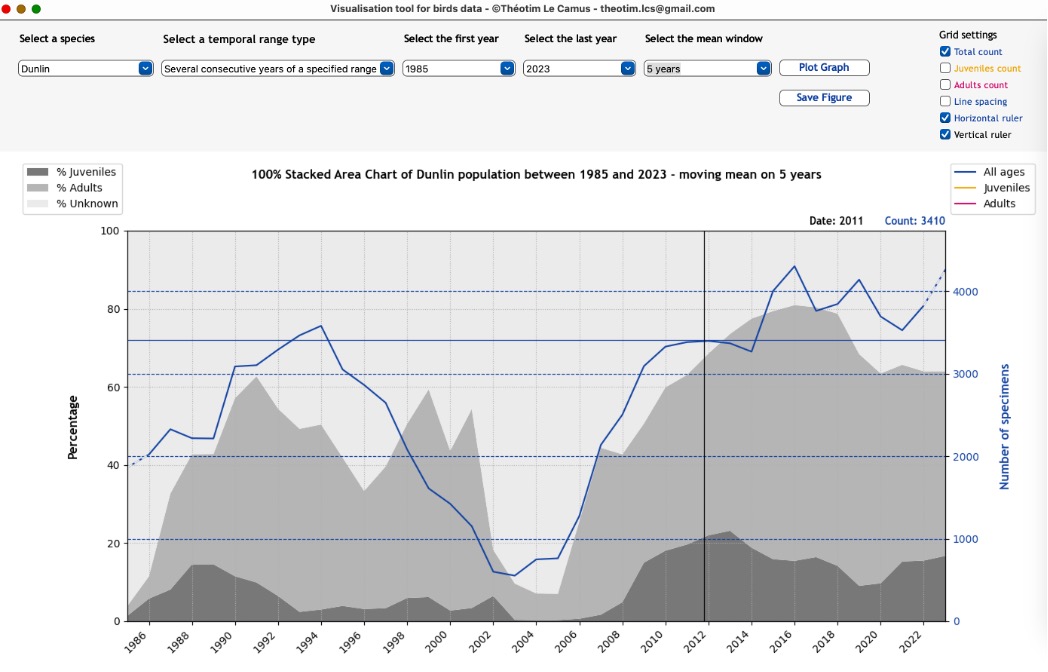
It is very challenging to accomplish all this with Excel because we are not free to manipulate the data as we wish. That’s why I decided to go a step further by creating an easy-to-use application. You simply need to select a few parameters, and the corresponding graph appears. You also have the option to easily save the curves as images, so you can compare them or use them in a document. Here is an example showing the Dunlin population between 1985 and 2023, with a 5-year moving average.

The background (in shades of gray) corresponds to the percentage of juveniles, adults, and individuals whose age could not be determined. The total number is displayed in blue and is read using the right-hand y-axis. If you're wondering what a 5-year moving average is, just know that each point on the curve is actually a time-based average calculated over 5 years and centered on the point of calculation. This allows us to take into account the values of the previous and following years, helping to smooth the curve.


